Recently I was tasked with identifying the high CPU issues in our production environment. We were seeing issues where the CPU increase was not really following the traffic patterns. This is a shared environment where lot of different processes are running on a single machine. CPU was consistently reaching 100 percent and was affecting the throughput and latency of other processes in this environment. The first step is identifying which processes are consuming high CPU during the peak load and trying to profile those process to see if we can find some bottle neck which are causing this issue. Lot of times, it might be that the CPU is spending lot of time in GC. It maybe due to allocation of Large Object Heap [LOH] or the process is allocating lot of object and keeping reference to them or there may be thread starvation issues etc.
In this particular scenario I found 3 processes which were contributing to the High CPU, lets call them
- Process 1 ( CPU Pattern is very unusual and not following the traffic pattern)
- Process 2 ( IO bound load but CPU is high)
- Process 3 ( CPU bound load)
You can see the CPU usage of all 3 processes.
Process 1 
Process 2 
Process 3 
Profiling the application using procdump or some other profiler which consumes the ETW events. You can get a lot of information about what is happening with your process at runtime from the dump. It is important when you take the dump as you need to take when the CPU shoots up. Procdump has lot of switches that you can use to take the dump when CPU > X Percent etc.
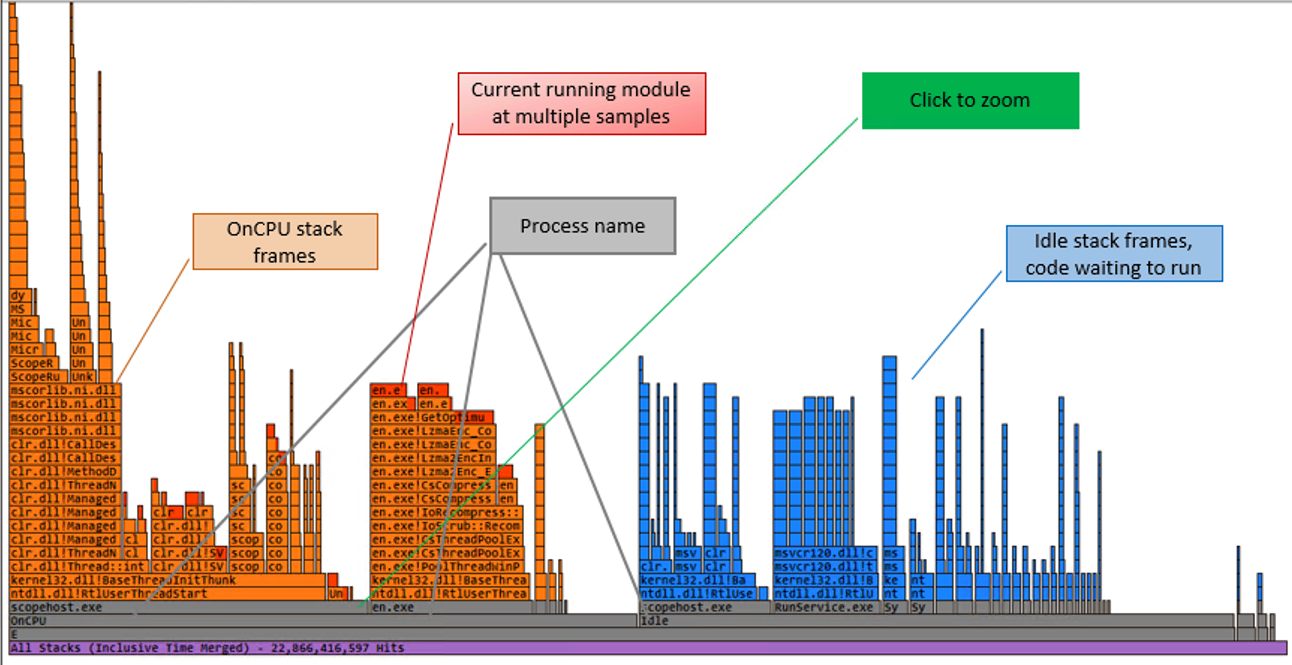
Flame graphs provides a very good way to visualize what was on the stack when the samples were taken. It gives you the hotspots in your application, the hotspots may be the bottleneck but there is no guarantee, as that maybe just how your application works.
- Each box represents a function in the stack.
- Y axis shows the stack depth. The top of the box represents the function that was on CPU when the sample was taken.
- X axis spans the sample population.
- The width of the box shows the total time it was on CPU or part of the ancestry that was on CPU.
- Functions with wide boxes may consume more CPU per execution than those with narrow boxes or they may simply be called often.
FlameGraph 
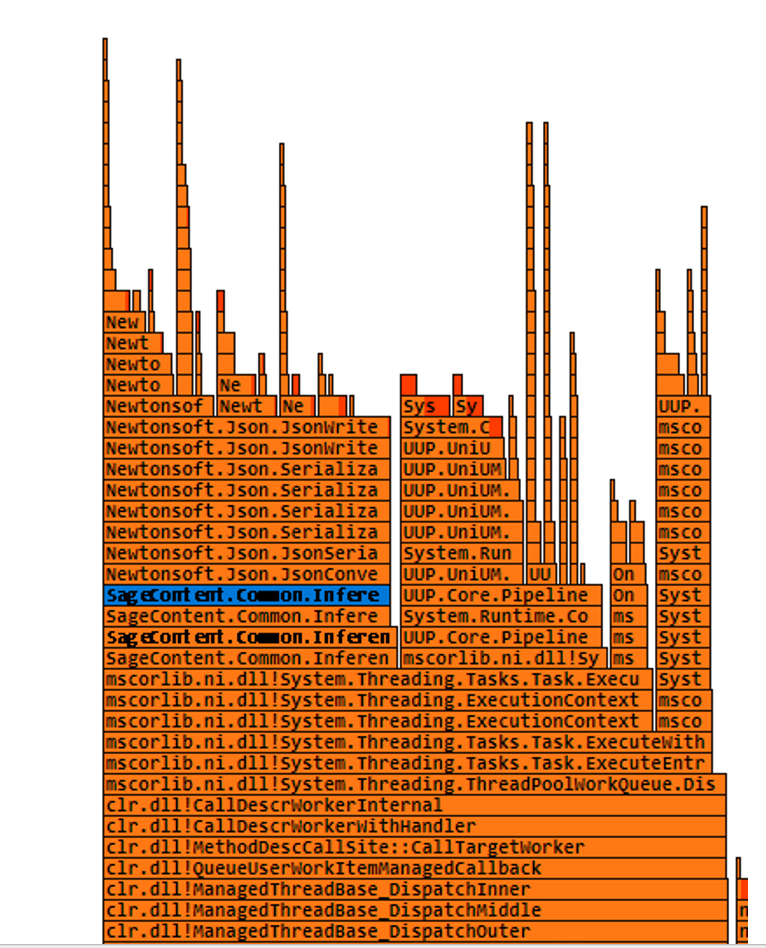
Process 1 Issue and Fix. ***
For the process 1 I saw that the stack points to json serialization/deserialization. Sure enough looking at the code, I see that huge files of json are getting serialized/deserialized when every request. Fix was to cache the deserialized version in a concurrent dictionary and serve subsequent requests from cache. This reduces the CPU a lot.

CPU after fix 
Process 2 Issue and Fix. ***
For Process 1 I saw that the code was pointing to a dictionary update and looking deeper into the code, I found that the dictionary was cached and for some reason the code was updating the cache dictionary by adding new entry in the loop. This looked like a bug. Fix was to clone the dictionary before any updates. That fixed the issues for this process.
This is an important article and I have seen similar cases in production scenarios.
https://www.tessferrandez.com/blog/2009/12/21/high-cpu-in-net-app-using-a-static-generic-dictionary.html

CPU after fix 
Process 3 Issue and Fix. ***
Process 3 issue was pretty straightforward as that process was CPU bound. So it was just about identifying what the hot path was and trying to see if we can reduce some computation in that code.
I ended up removing some not needed processing and that brougt down the CPU to half.
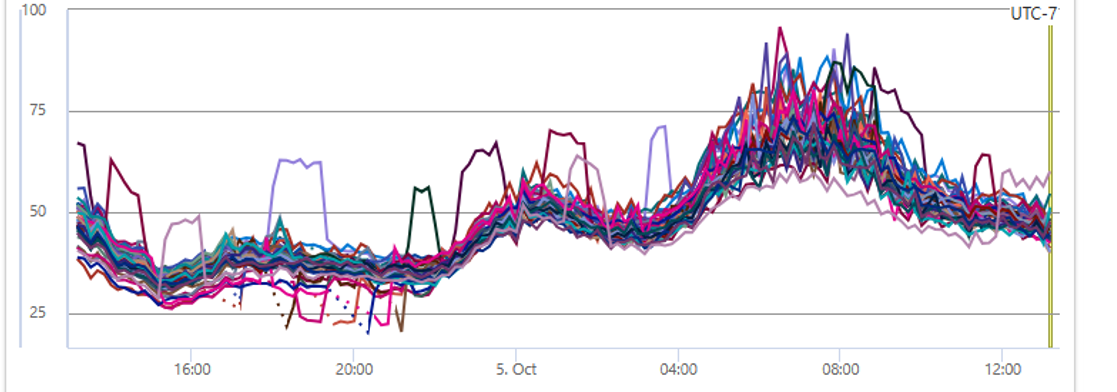
Over all the final CPU in the environment looked like below, which follows the traffic pattern.

Happy Learning and improving one day at a time